
The Heat Pipe Transient Analysis Model "HPTAM" (Figure 28) was developed at UNM-ISNPS for simulating the transient and steady-state operation, as well as the startup from a frozen state of alkali-metal and low-temperature heat pipes [35-38]. Heat pipes are used in many space nuclear reactor power systems for transporting the reactor's thermal power to the converters (lithium or sodium heat pipes), transporting the waste heat from the cold side of the converters to the heat rejection radiator (sodium or potassium heat pipes), and/or for spreading the heat in finned radiator surfaces (potassium, rubidium or water radiator heat pipes). HPTAM has been the subject of continuous upgrade since the early nineties using experimental data for water, Na (Fig. 29), and lithium (Fig. 30) heat pipes.
The fully 2-dimensional and transient HPTAM model (Figure 28) uses the Darcy's extended flow equations to model the liquid flow in the porous wick and annular space, in conjunction with a fixed-grid, homogeneous enthalpy method to calculate the change of phase in these zones. HPTAM calculates the radius of curvature of the liquid meniscus in the surface pores of the wick, and couples the vapor and wick regions with appropriate momentum and enthalpy jump conditions, which allows HPTAM to predict the capillary limit, partial recession of liquid in the evaporator wick, and pooling of excess liquid in the vapor core. HPTAM also calculates the rates of sublimation of the frozen working fluid in the evaporator and resolidification in the adiabatic and condenser sections early during the startup from a frozen state, and simulates the free-molecule, transition, and continuum vapor flow regimes using the Dusty Gas Model.
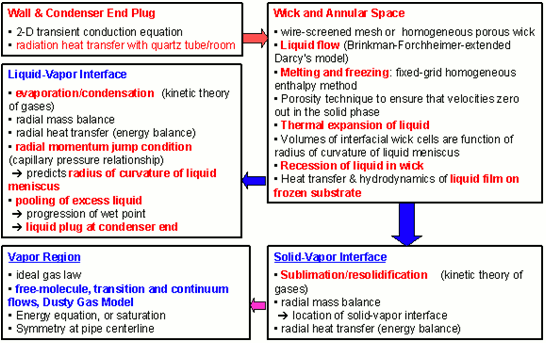
Figure 28. A Block-Diagram of the physical models Integrated into HPTAM for transient simulation of liquid-metal and water heat pipes, including the startup from a frozen state [35-37].
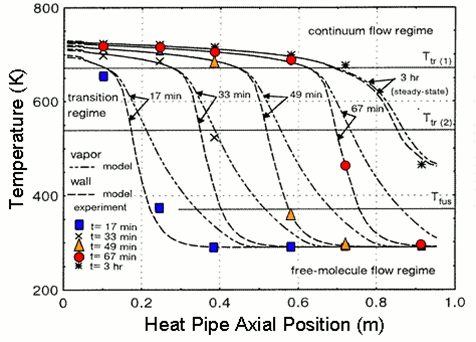
Figure 29. HPTAM's predictions of the axial distributions of wall and vapor temperatures during startup of a sodium heat pipe [36 ] (Data from Faghri et al., 1991).
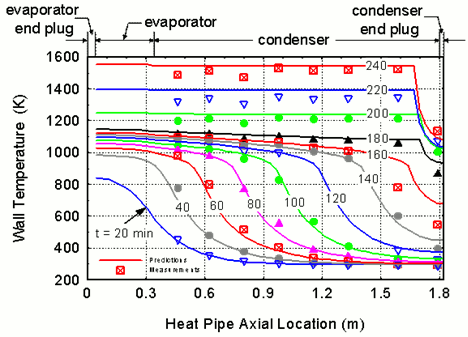
Figure 30. HPTAM's predictions of the wall temperature during startup of lithium heat pipe; symbols represent TC data at particular times [37] (data from Reid, Sena, Merrigan, Elder and Martinez 1999).
Back to The Top